Crystallographic structure refinement can involve hundreds of millions of calculations for a single iteration of structure refinement; careful optimisation plays an important role in determining how efficiently the software makes uses of the available CPU power. The following freely available tools help identify bottlenecks in software implementations, and allow testing potentially faster algorithms and compiler options. On recent CPUs, a carefully optimised algorithm can easily be ten times faster than a naïve implementation. Not only does this save time, but it also enables the use of larger data sets and more complicated models to tackle ever more complicated problems. A time-critical portion of code from the crystallographic refinement package CRYSTALS is analysed here.
All the software tools discussed are free and open source, running on the Linux operating system. Some of them are not available on Windows.
Profiling
The first optimisation step is profiling the execution of the existing code and algorithms. This will reveal exactly how much time is spent in functions, lines of code, and even assembly instructions. Two approaches are common:
- Emulating a CPU in software and then counting every instruction executed. This is the method used in valgrind. It can also look for memory leaks. Because the CPU is emulated, it can take up to 200 times longer than normal code execution.
- Exploiting hardware counters directly inside the CPU. These counters can be checked at fixed intervals and then recorded. While there is almost no performance penalty compared to the normal execution, it can be inaccurate. The software perf from the linux kernel can exploit them.

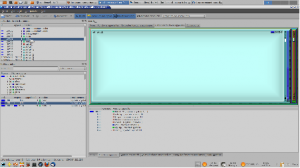
KCacheGrind: the coloured regions correspond to different functions in the software while the area of each corresponds to the time spent in that function during execution.
This example uses the least-squares refinement routine (\sfls) in the crystallographic analysis package CRYSTALS. A decent size data set (http://dx.doi.org/10.1107/S1600536813007757) from the journal Acta Crystallographica Section E has been used. The command line version of CRYSTALS (compiled with COMPCODE=LIN) was compiled on Linux using the open source compiler gfortran. The executable was then profiled using the software valgrind and the profiling data were analysed with kcachegrind. The output includes a graphical map (shown below) in which coloured regions correspond to different functions in the software and the area of each region corresponds to the time spent in that function during execution.
The same data has been analysed using the software perf with the following result:
89.94% crystals crystals      [.] adlhsblock_
 3.71% crystals crystals      [.] xchols_
 2.90% crystals crystals      [.] xsflsx_
 0.89% crystals libm-2.17.so  [.] __expf_finite
 0.44% crystals crystals      [.] xzerof_
In both cases, the profile analysis reveals that about 90% of the time is spent in the adlhsblock function, which is just 21 lines long including declarations. The body of the function is shown below (accumula.F, revision 1.8).
I = 1
do ROW=1, BLOCKdimension  ! Loop over all the rows of the block
    CONST = DERIVS(ROW)   ! Get the constent term
    do COLUMN = ROW, BLOCKdimension
        MATBLOCK(I) = MATBLOCK(I) + CONST*DERIVS(COLUMN) ! Sum on the next term.
        I = I + 1         ! Move to the next position in the matrix
    end do
end do
Instruction level analysis
The adlhsblock function is forming the normal matrix from the design matrix and is mathematically doing the matrix multiplication Zt Z. To save memory, the design matrix is not stored completely and the calculation is done reflection by reflection, multiplying and accumulating the outer product of one row of Z. Furthermore, only the upper triangle of the normal matrix is stored, which reduces the number of operations, but makes for convoluted row/column indexing of the elements.
Further investigation of the code profiling within the function indicates that the bottleneck is on the line:
MATBLOCK(I) = MATBLOCK(I) + CONST*DERIVS(COLUMN)
The assembly instructions also revealed the used of scalar instructions.
0.09 Ōöé70: vmovss (%rsi),%xmm0
21.21 Ōöé add $0x4,%rsi
Ōöé MATBLOCK(I) = MATBLOCK(I) + CONST*DERIVS(COLUMN)
0.05 Ōöé78: vmulss %xmm0,%xmm1,%xmm0
12.24 Ōöé movslq %ecx,%rcx
0.12 Ōöé lea -0x4(%rdx,%rcx,4),%rcx
20.42 Ōöé vaddss (%rcx),%xmm0,%xmm0
13.35 Ōöé vmovss %xmm0,(%rcx)
Ōöé I = I + 1
20.91 Ōöé mov %eax,%ecx
0.06 Ōöé add $0x1,%eax
Modern CPUs include two kind of processing units: scalar units (which process one input at a time) and vector units (which can process multiple input at the same time with the same operation). The latter instructions are called SIMD. The performance of SIMD can be outstanding compare to scalar instructions: On a Sandy bridge Intel processor the vector instructions can operate on up to eight single precision numbers at the same time. Compilers can automatically use these instructions based on patterns in the source code (see http://gcc.gnu.org/projects/tree-ssa/vectorization.html). However it is advisable to always check if a loop has been vectorized as expected as some restrictions may apply (see http://blog.debroglie.net/2013/04/14/autovectorization-not-vectorized-not-suitable-for-gather/). The use of scalar instructions is symptomatic of a suboptimal optimisation.
Optimisation and analysis
The standard optimisation level compiler switch for CRYSTALS in the Linux makefile is ŌĆś-O2ŌĆÖ which does not include autovectorisation (autovectorisation is enabled at ‘O3’ level). CRYSTALS was therefore compiled with autovectorisation enabled (-ftree-vectorize -msse2) and did not give any speed up. Applying the flag (-ftree-vectorizer-verbose) and checking the output during compilation confirmed that no loop had been vectorised. In order to improve the situation the inner loop was removed and replaced with array operations and the recursive dependency on the indices was removed.
do ROW=1, BLOCKdimension
   i = ((row-1)*(2*blockdimension-row+2))/2+1
   j = i + blockdimension - row
   MATBLOCK(i:j) = MATBLOCK(i:j)+DERIVS(ROW)* derivs(row:BLOCKdimension)
end do
The new version has been compared to the original given different level of optimisation:
| Compilation flag |
Original code (Wall clock time in s) |
New code (Wall clock time in s) |
| -O2 |
16 |
12 |
| -O2 -ftree-vectorize -msse2 |
16 |
6.7 |
| -O2 -ftree-vectorize -mavx |
16 |
5.0 |
The improvement without vectorization (16s to 12s) is surprising: Because each cycle in the loop is independent the greater flexibility could be exploited by the scheduler to reorder instructions for greater efficiency. When using sse2 or avx instructions the new version is much faster still. The double size of the avx vector compare to sse is also clearly visible.
The new code was profiled using perf and compared to the original one. The bottleneck remains in the adlhsblock function, but the assembly output confirms the use of the vectorised avx intructions (vmulps and vaddps for example).
85.75% crystals crystals     [.] adlhsblock_
 5.40% crystals crystals     [.] xchols_
 4.40% crystals crystals     [.] xsflsx_
 1.30% crystals libm-2.17.so [.] __expf_finite
 0.61% crystals crystals     [.] xzerof_
      |         MATBLOCK(i:j) = MATBLOCK(i:j)+DERIVS(ROW)*derivs(row:BLOCKdimension)
 2.35 |15a: vmovup (%r11,%rcx,1),%xmm1
 8.42 |     add $0x1,%r8
 4.73 |     vinser $0x1,0x10(%r11,%rcx,1),%ymm1,%ymm1
 7.91 |     vmulps %ymm2,%ymm1,%ymm1
 8.82 |     vaddps (%r14,%rcx,1),%ymm1,%ymm1
41.82 |     vmovap %ymm1,(%r14,%rcx,1)
12.10 |     add $0x20,%rcx
 2.62 |     cmp %r8,%r13
      |   ? ja 15a
Using code profiling to identify a bottleneck, followed by optimisation of the algorithm and appropriate choice of compiler switches result in least-squares refinement that is up to three times faster.


 The traditional Waser distance restraint, the rigid-bond restraint and atomic displacement parameter (ADP) similarity restraints have an equal influence on both atoms involved in the restraint. This may be inappropriate in cases where it can reasonably be expected that the precision of the determination of the positional parameters and ADPs is not equal, e.g. towards the extremities of a librating structure or where one atom is a significantly stronger scatterer than the other. In these cases, the traditional restraint feeds information from the poorly defined atom to the better defined atom, with the possibility that its characteristics become degraded. The modified restraint described here feeds information from the better defined atom to the more poorly defined atom with minimal feedback.
 Leverages measure the influence that observations (intensity data and restraints) have on the fit obtained in crystal structure refinement. Further analysis enables the influence that observations have on specific parameters to be measured. The results of leverage analyses are discussed in the context of the amino acid alanine and an incomplete high-pressure data set of the complex bis(salicylaldoximato)copper(II). Leverage analysis can reveal situations where weak data are influential and allows an assessment of the influence of restraints. Analysis of the high-pressure refinement of the copper complex shows that the influence of the highest-leverage intensity observations increases when completeness is reduced, but low leverages stay low. The influence of restraints, notably those applying the Hirshfeld rigid-bond criterion, also increases dramatically. In alanine the precision of the Flack parameter is determined by medium-resolution data with moderate intensities. The results of a leverage analysis can be incorporated into a weighting scheme designed to optimize the precision of a selected parameter. This was applied to absolute structure refinement of light-atom crystal structures. The standard uncertainty of the Flack parameter could be reduced to around 0.1 even for a hydrocarbon.